Learning to Read Technical Analysis Charts for Trading
When it comes to the world of trading, there are many different strategies and techniques that investors use to make informed decisions about the market. One popular method is technical analysis, which involves analyzing charts and patterns to determine future price movements. While this may seem overwhelming and complex at first, learning how to read technical analysis charts can be a valuable skill for any trader looking to improve their results. In this article, we will discuss the basics of technical analysis and provide tips for reading charts effectively.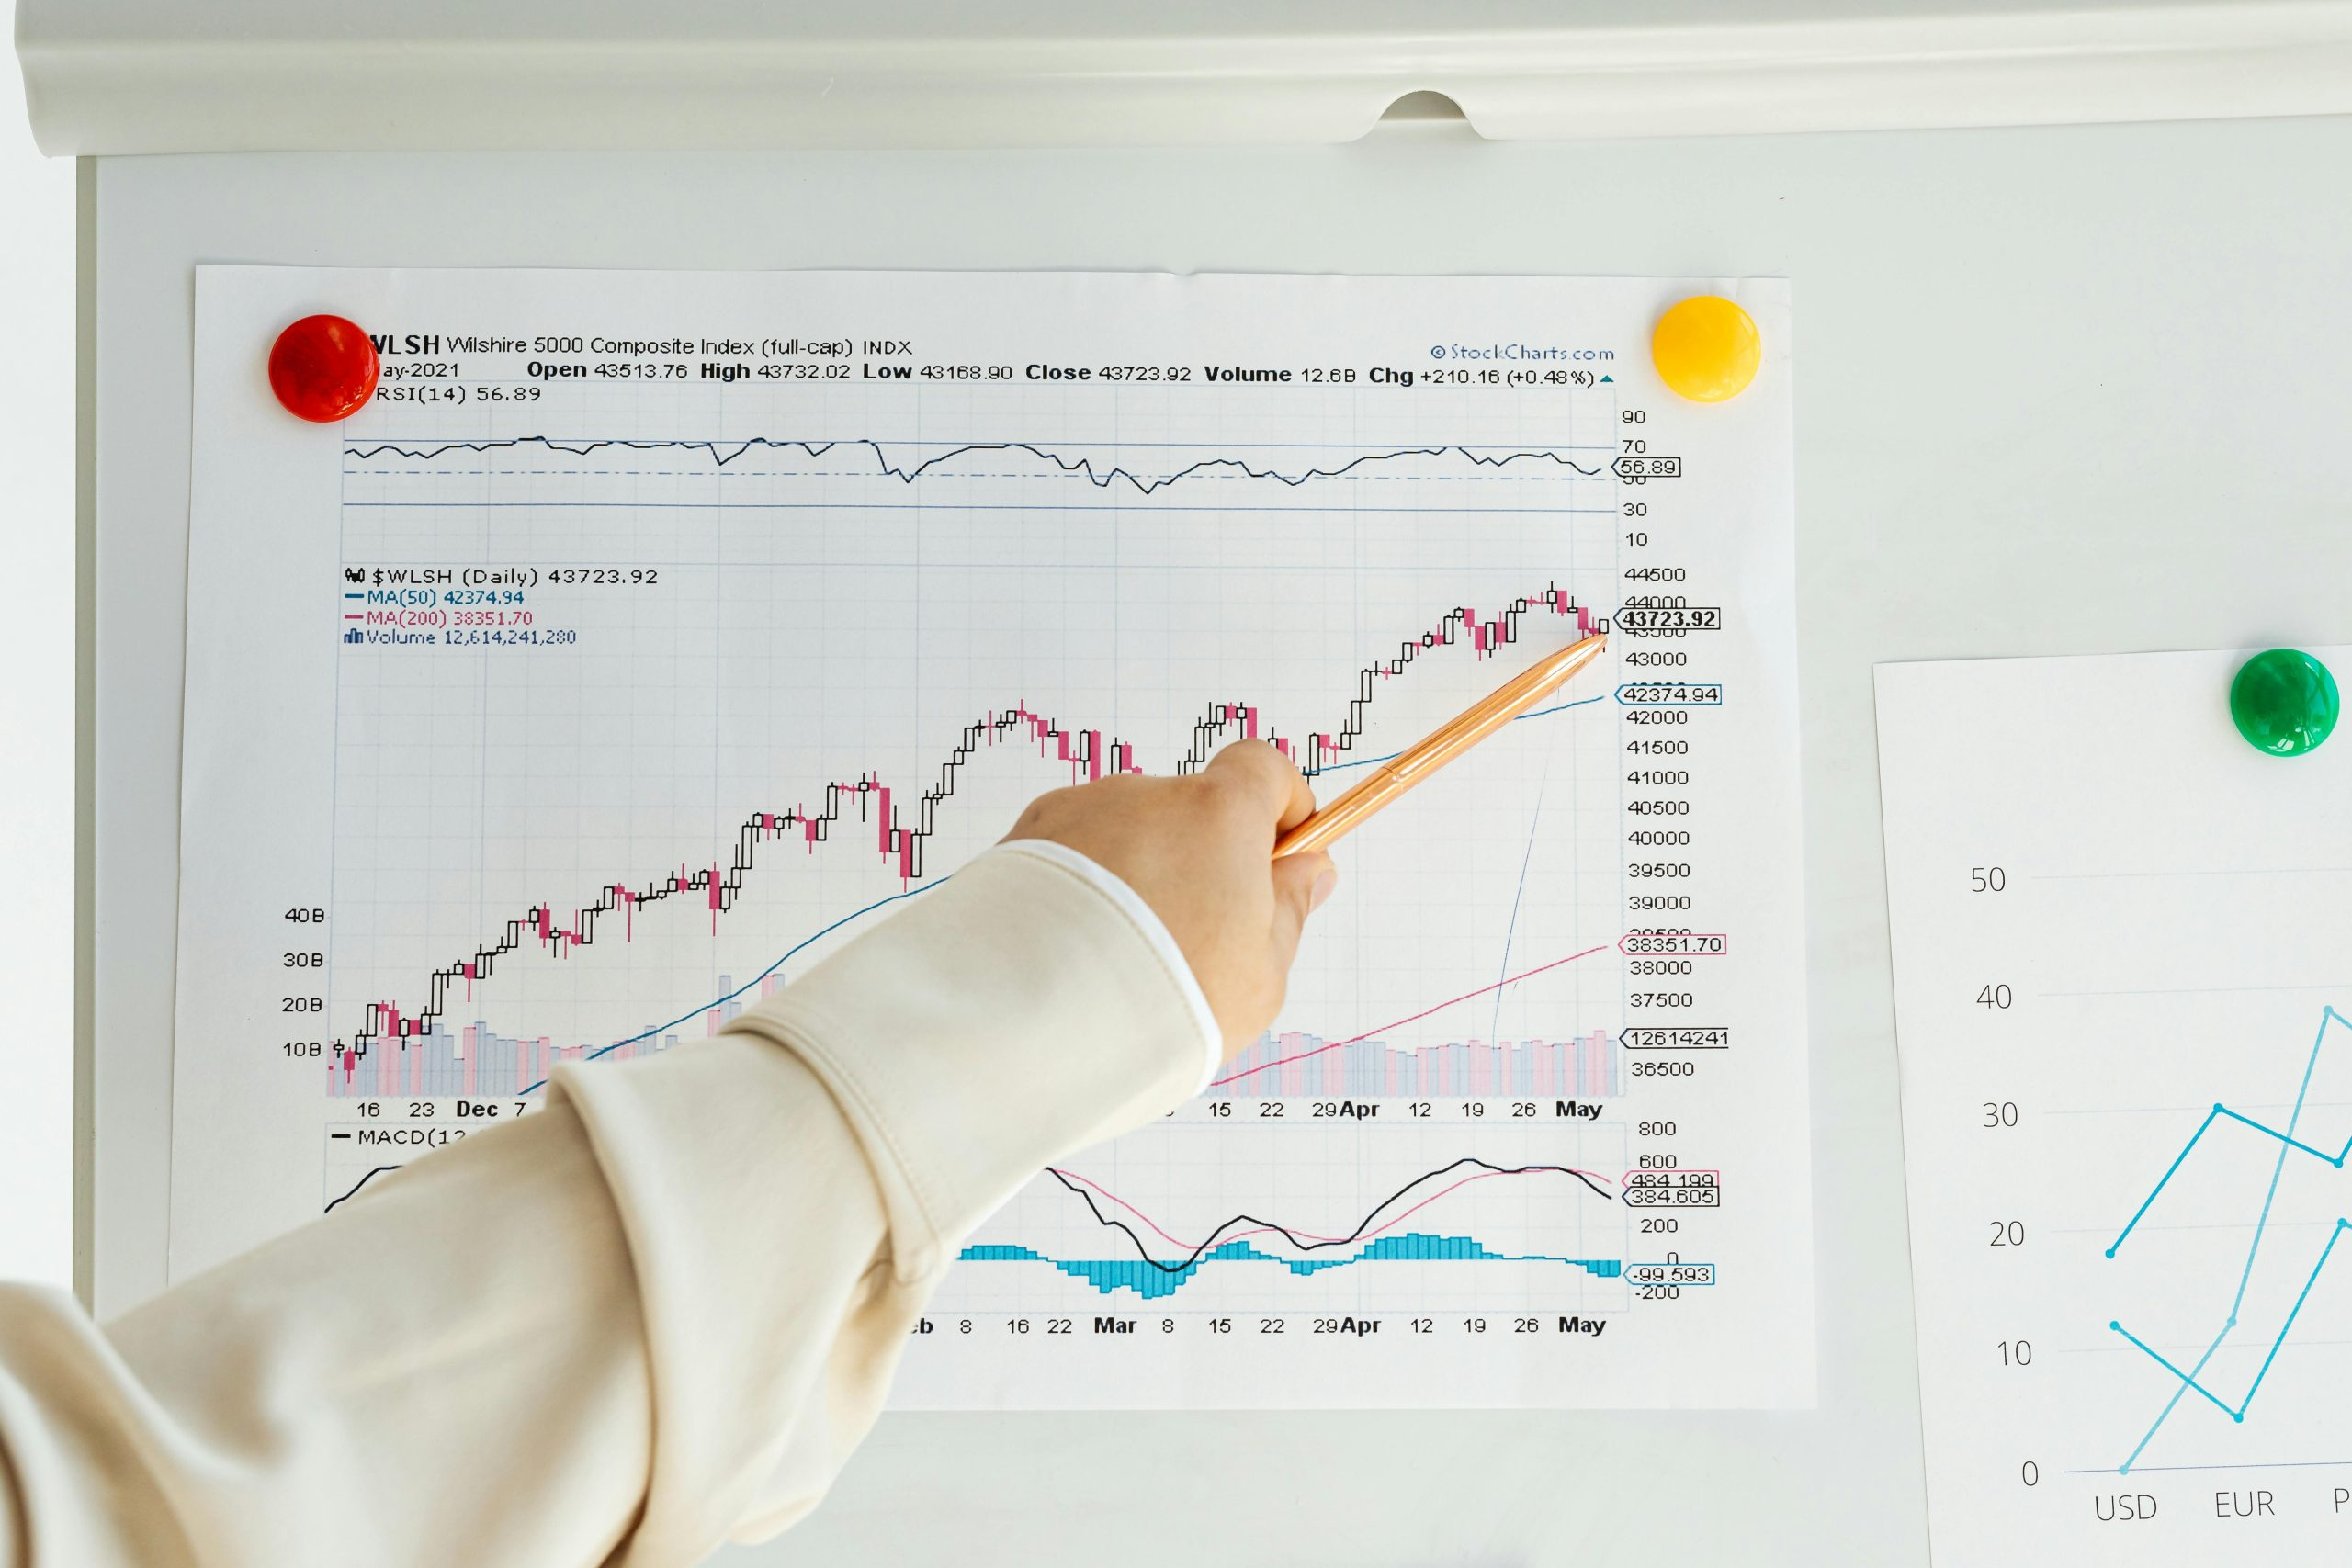
Understanding Technical Analysis
Before diving into how to read technical analysis charts, it’s important to have a basic understanding of what technical analysis actually is. Essentially, technical analysis involves analyzing past market data, such as price and volume, to identify patterns and trends that can help predict future price movements. This approach is based on the belief that the market moves in trends and that history tends to repeat itself.
While fundamental analysis looks at a company’s financial health and economic factors to make trading decisions, technical analysis focuses solely on the price action of a security. This means that technical analysis can be used for any type of trading, whether it’s stocks, forex, or cryptocurrency.
The Components of Technical Analysis Charts
Technical analysis charts may vary in appearance, but there are some common components that you’ll find in most charts:
1. Price Chart
The price chart is the main component of technical analysis charts and is used to track the price movements of a security over a certain period of time. A common type of price chart is the candlestick chart, which consists of a series of candles representing each time period. The color of the candle indicates whether the price has gone up (green) or down (red) during that time period.
2. Volume
In addition to price, volume is another important component of technical analysis charts. Volume represents the number of shares or contracts traded during a specific time frame and can provide insight into market interest and sentiment.
3. Indicators
Indicators are mathematical calculations based on price and/or volume data that are used to identify patterns and trends in the market. They can serve as valuable tools for traders, but it’s important to keep in mind that they should not be relied upon as the sole basis for making trading decisions.
Tips for Reading Technical Analysis Charts
1. Start with the Basics
If you’re new to technical analysis, it’s important to start with the basics. This means familiarizing yourself with common chart patterns, support and resistance levels, and the use of indicators. It’s also helpful to focus on one trading instrument and become an expert in analyzing its charts before branching out to others.
2. Pay Attention to Trends
As mentioned earlier, technical analysis is based on the belief that the market moves in trends. It’s important to pay attention to these trends and try to identify when they may be changing. This can help you make more accurate predictions about the market’s future movements.
3. Combine Technical Analysis with Other Strategies
While technical analysis can be a powerful tool, it’s important to remember that it should not be used in isolation. It’s always a good idea to combine it with other strategies, such as fundamental analysis and risk management, to make well-informed trading decisions.
4. Practice, Practice, Practice
Reading technical analysis charts takes time and practice. Don’t get discouraged if you don’t see results right away. Keep honing your skills and analyzing charts regularly to improve your understanding and gain more confidence in your trading.
Conclusion
Learning how to read technical analysis charts is a valuable skill for traders of all levels. By understanding the basics of technical analysis, paying attention to trends, and combining it with other strategies, you can make more informed trading decisions and improve your results. Remember to always practice and continue learning to refine your skills and stay ahead in the ever-changing world of the market.